“Millipore” testing is a popular way of quantifying part cleanliness today. What is generally not known, however, is that it is far from an absolute standard and, in fact, can be very misleading even if “properly” applied. Part of this may be due to the genesis and heritage of Millipore testing. At its inception, Millipore testing was used to evaluate cleaning by measuring the weight of contamination that could be collected from the surface of a part using a more effective cleaning method than that used in a production atmosphere. This is called “gravimetric” analysis. For example, remaining contaminant on a part that had been spray washed in an aqueous system might be collected by flushing or brushing with solvent. As production cleaning methods became more effective, advanced techniques including ultrasonics have been used to collect remaining contaminant for evaluation. The method of weighing the remaining contaminant as a measure of cleanliness was quite effective and repeatable and therefore established Millipore testing as a good benchmark for cleanliness. Weight is an absolute standard – a gram is a gram is a gram!
As needs changed and cleaning requirements became more demanding a need to know not only the weight of the contaminant but its nature as well emerged. With this need, Millipore testing moved from being strictly a weight analysis to one of counting and measuring the size of contaminating particles as well. This was driven primarily by the need for fluids to pass through orifices that could be clogged by large or particularly shaped particles and was largely promulgated by the automotive industry. At first, particles were collected on Millipore filters on which a cross grid of lines had been printed or using a microscope reticule. The particles were counted and sized manually – a tedious process. Eventually, microscopes with computer driven stages and software capable of analyzing digital images to detect particles came into use. But this innovation, despite its efficiency and convenience had, in my opinion, a deleterious effect on the amount and quality of information that was collected.
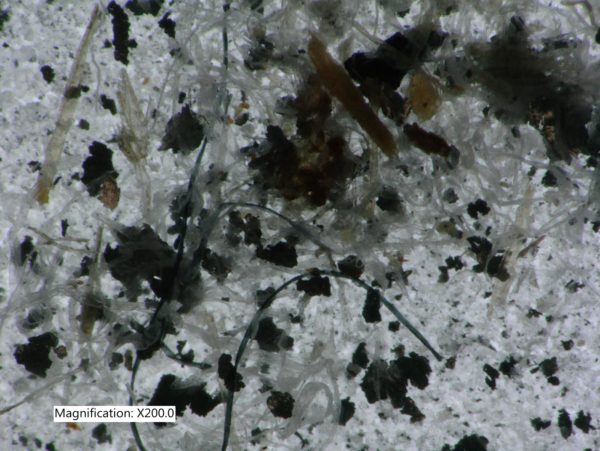
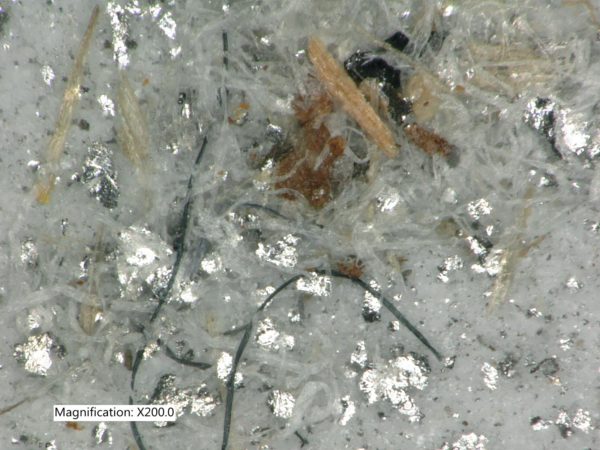
These two pictures may help me make my point.


The pictures above are of the same field. The one at the top is, basically, what the software sees in an automated analysis. The bottom picture allows a better opportunity to analyze the contaminants. In the days of manual counting, each particle could not only be counted and sized but also to some degree categorized. Things like fibers, plastic burrs, different sized and shaped chips of metal and sometimes even the type of metal could be deciphered. If only metallic particles were of concern, fibers or flakes of plastic could be discounted through observation. Manual evaluation also was often able to provide information that could lead to the source of the contamination to allow manufacturing changes to reduce particles at their source. Although software and algorithms are continuously improving they are still dependent on their proper use. The human factor has not been eliminated. Taking one example, part of the evaluation procedure using automated techniques is establishing the threshold for detection – basically what level of intensity and contrast constitute the detection of a particle. In most cases this is a judgement call on the part of the operator and the smallest increment of change may result in a huge difference in the result. Still, this is manageable in a fixed environment testing the same parts for the same contaminants day after day. However, Millipore testing should not be considered the be all and end all of particle analysis. In some cases it is a very accurate method of evaluating cleanliness but in others falls short of the mark.
– JF –

 Water – De-ionized – Hints
  A Fond Farewell to John Fuchs
  Millipore Testing – Evaluation by Particle Counting
  Tape Test for Cleaning Revisited